.jpg)
Machine learning servises split into two fundamentally different approaches. In supervised learning, each example in the training set has its correct answer. The model learns from labeled data and then applies patterns to new records. The machine learning tasks we encounter so often, like email classification, price forecasting, face recognition, are all supervised tasks.
Unsupervised machine learning works the opposite way. You feed the algorithm raw data, no labels, no hints about what to look for. Its job is to independently discover structure, group similar objects, find anomalies or hidden dependencies. This approach is a godsend for business. Data labeling costs a fortune. You need experts, time, annotation tools. When you have millions of transactions or customer sessions, manual tagging simply isn't realistic.
In this article we'll look at the main types of unsupervised learning tasks, break down key unsupervised machine learning algorithms and show real use cases.
What is Unsupervised Machine Learning?
What is unsupervised machine learning in simple terms? It's an approach where the algorithm works with unlabeled data. The input is a set of records without any labels or categories, and the model independently searches for structure within them: groups similar objects, detects anomalies, finds patterns. That's why unsupervised machine learning works best when labeling is impossible or costs more than it's worth.
Difference Between Supervised and Unsupervised Machine Learning
The main difference between supervised and unsupervised machine learning lies in the input data. Supervised models train on examples where each record has the correct answer. There's a photo of a cat labeled "cat", there's a transaction marked "fraud". The model learns to reproduce this connection between input features and the outcome. As a company providing AI development services, we rely on this approach when clients need predictable, measurable results from their data.
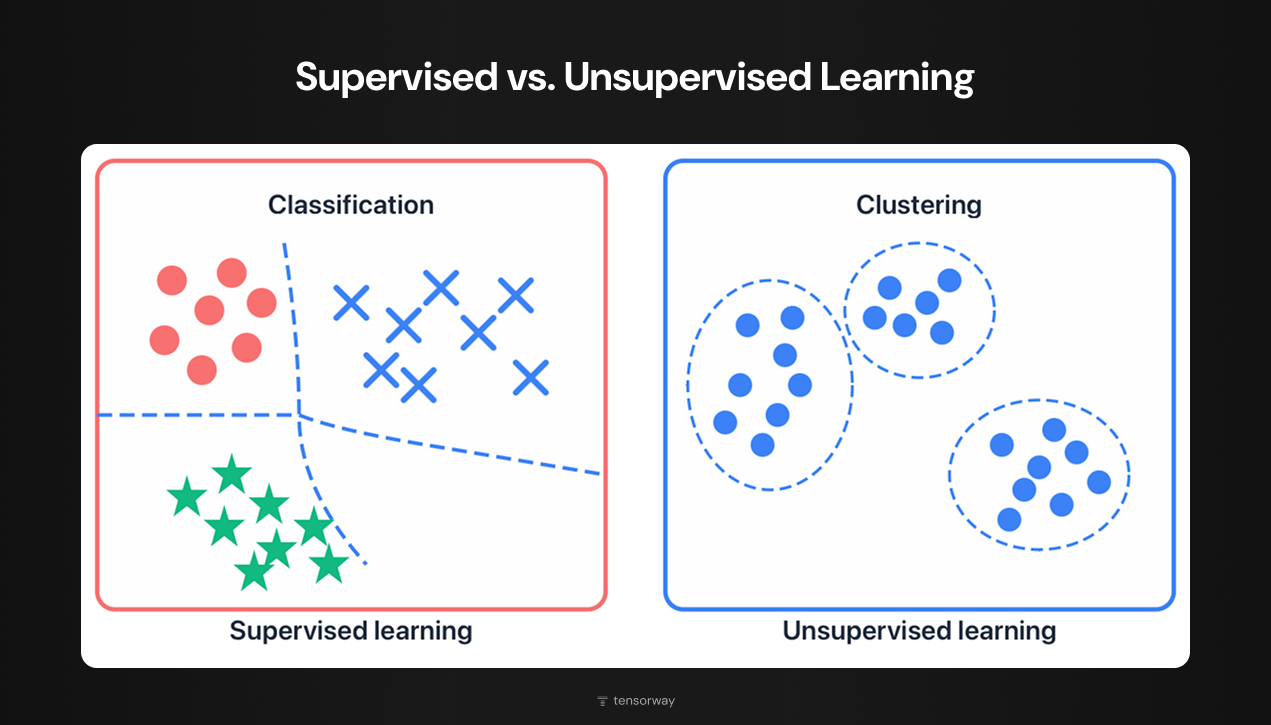
The difference between approaches can also be explained more clearly using the diagram above.
The left side shows supervised learning through a classification example. Notice: the points have different shapes and colors (circles, crosses, stars). These are exactly those labels that mark the training data. The algorithm already knows that red circles belong to one category, blue crosses to another, green stars to a third.
The right side demonstrates unsupervised learning. All points are identical (no labels, no hints about group membership). The algorithm itself determines that the data naturally falls into three clusters and draws boundaries between them based on its own calculations.
In supervised learning we know in advance what result we want to get. In unsupervised we don't know what exactly we're looking for. We give the algorithm data and see what structure it discovers.
Key Types of Unsupervised Learning Tasks
Unsupervised machine learning models tackle three core tasks. Clustering groups similar data points together. Association rules uncover hidden connections between variables. Dimensionality reduction compresses complex datasets while preserving what matters. Let's break down each method and the algorithms behind them.
Clustering
Clustering is a data mining method that groups unlabeled data based on their similarities or differences. Clustering algorithms process untagged objects and distribute them into groups represented by structures or patterns in the information. A typical example is customer segmentation. We have a customer database with information about age, purchase frequency, average check, favorite product categories. Clustering discovers segments on its own by looking at how all these features combine.
Types of Clustering
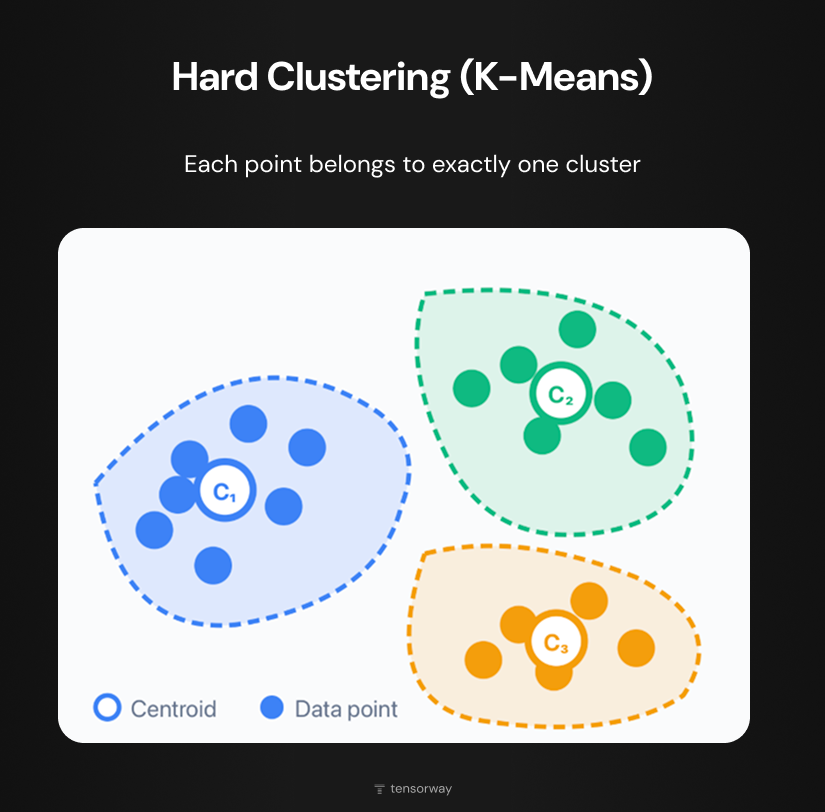
Hard clustering works on the principle of clear distribution, meaning one object belongs to only one cluster. In the diagram this appears as three separate areas with points of different colors, where each point belongs exclusively to one cluster. The most famous algorithm of this type is K-Means. It divides data into a specified number of clusters (K), minimizing the distance between points and the group centroid (marked in the diagram as C₁, C₂, C₃). The method is fast and scales well on large datasets, so it's often used as a first step for exploratory analysis.
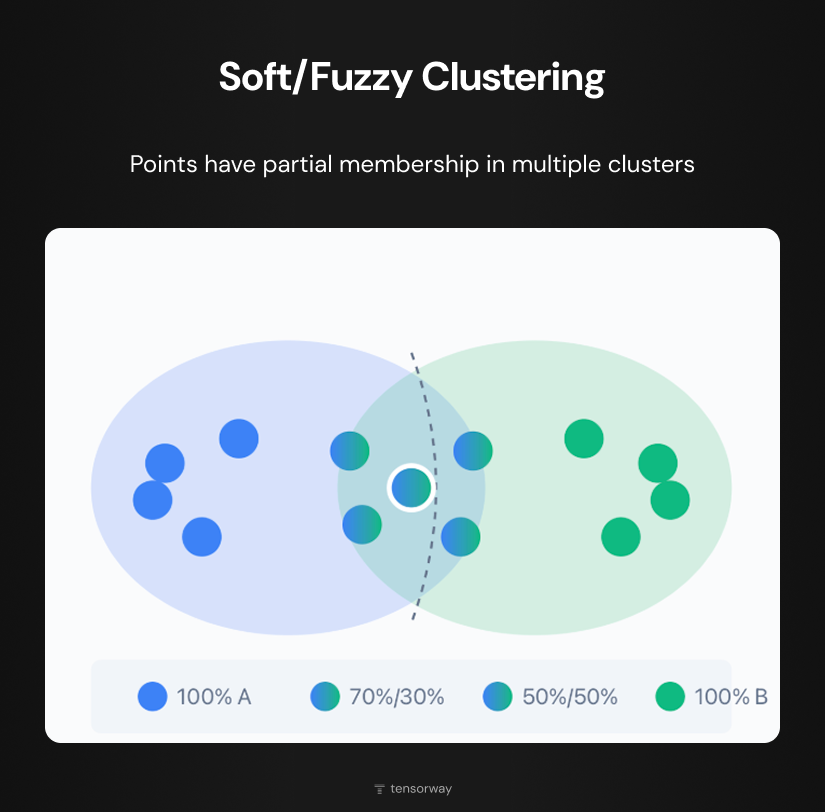
Overlapping clustering (soft/fuzzy clustering) allows partial membership in several clusters simultaneously. In the diagram two clusters overlap, forming a shared zone. Points at the edges have pure color and belong to one group at 100%. Points in the overlap zone have gradient coloring that reflects their partial membership: 70%/30%, 50%/50% and so on. This approach more accurately reflects real situations where boundaries between categories are blurred. Fuzzy C-Means is the most common algorithm of this type, working similarly to K-Means but instead of hard assignment it calculates the degree of membership in each cluster.
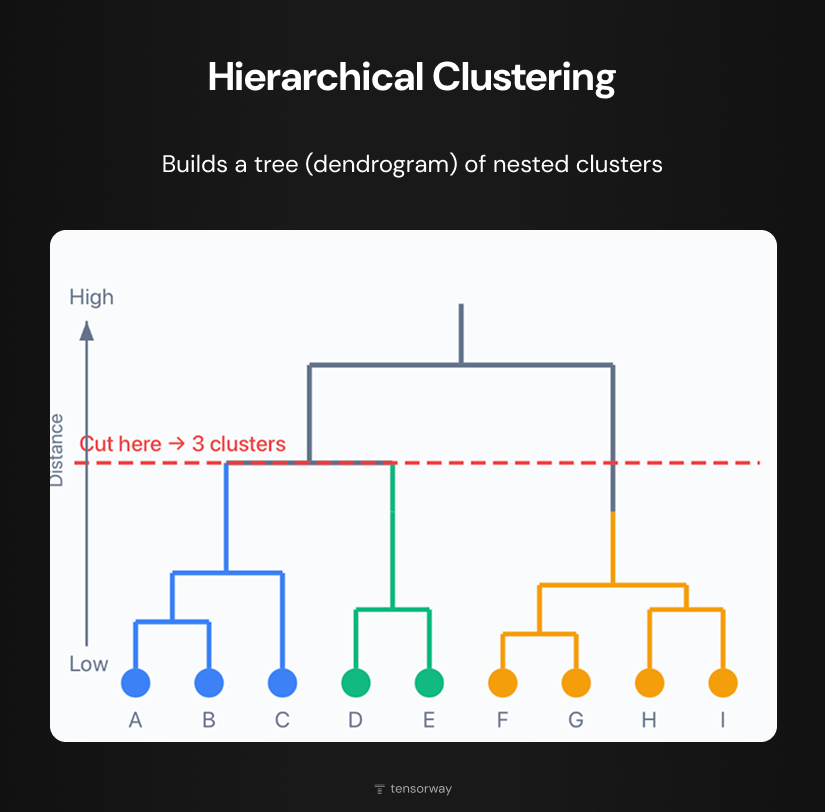
Hierarchical clustering builds a hierarchy of groups in the form of a tree, a dendrogram. In the diagram at the bottom are individual data points (A-I) that gradually combine into larger groups through vertical and horizontal lines. The higher the connection occurs, the greater the distance between objects. The advantage of this method is that you don't need to specify the number of clusters in advance. The horizontal cut line in the diagram shows: cutting the tree at this level gives us three clusters.
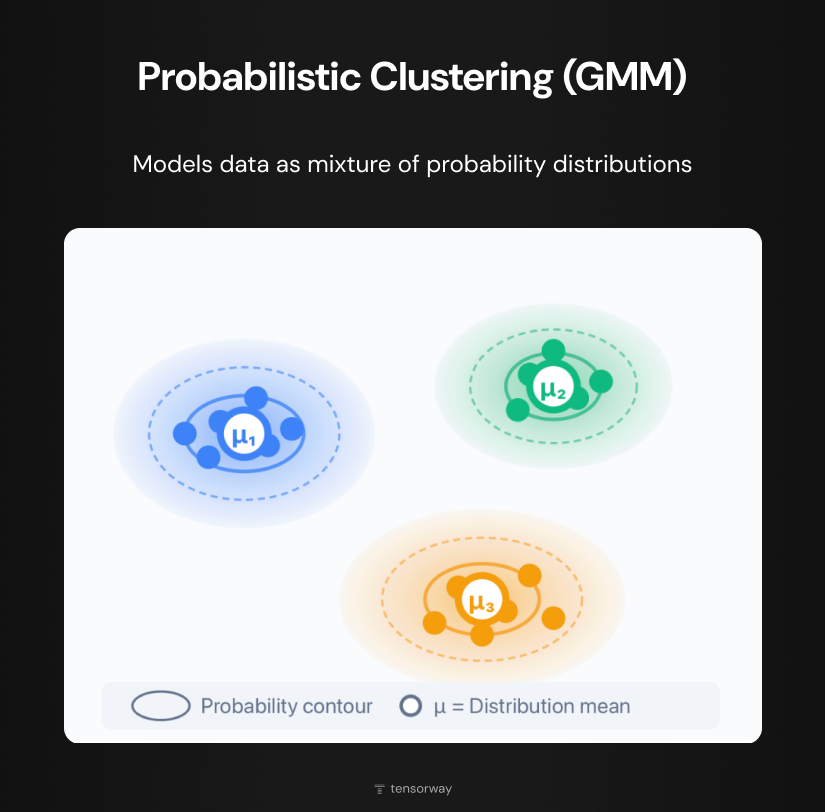
Probabilistic clustering models data as a mixture of several probability distributions. In the diagram each cluster is represented by an ellipse with a gradient (color intensity decreases from the center (μ) to the edges, reflecting the decline in probability). The contours inside the ellipses show levels of equal probability. The most common method is Gaussian Mixture Models (GMM). Unlike fuzzy clustering, which simply assigns degrees of membership, GMM builds a statistical model of data generation. This allows evaluating how likely new objects are to appear in each group.
Association Rule Learning
Association rule learning reveals connections between elements in transactional data. The algorithm's output is rules in the format "if X, then Y", where X and Y can be products, user actions, or system events.
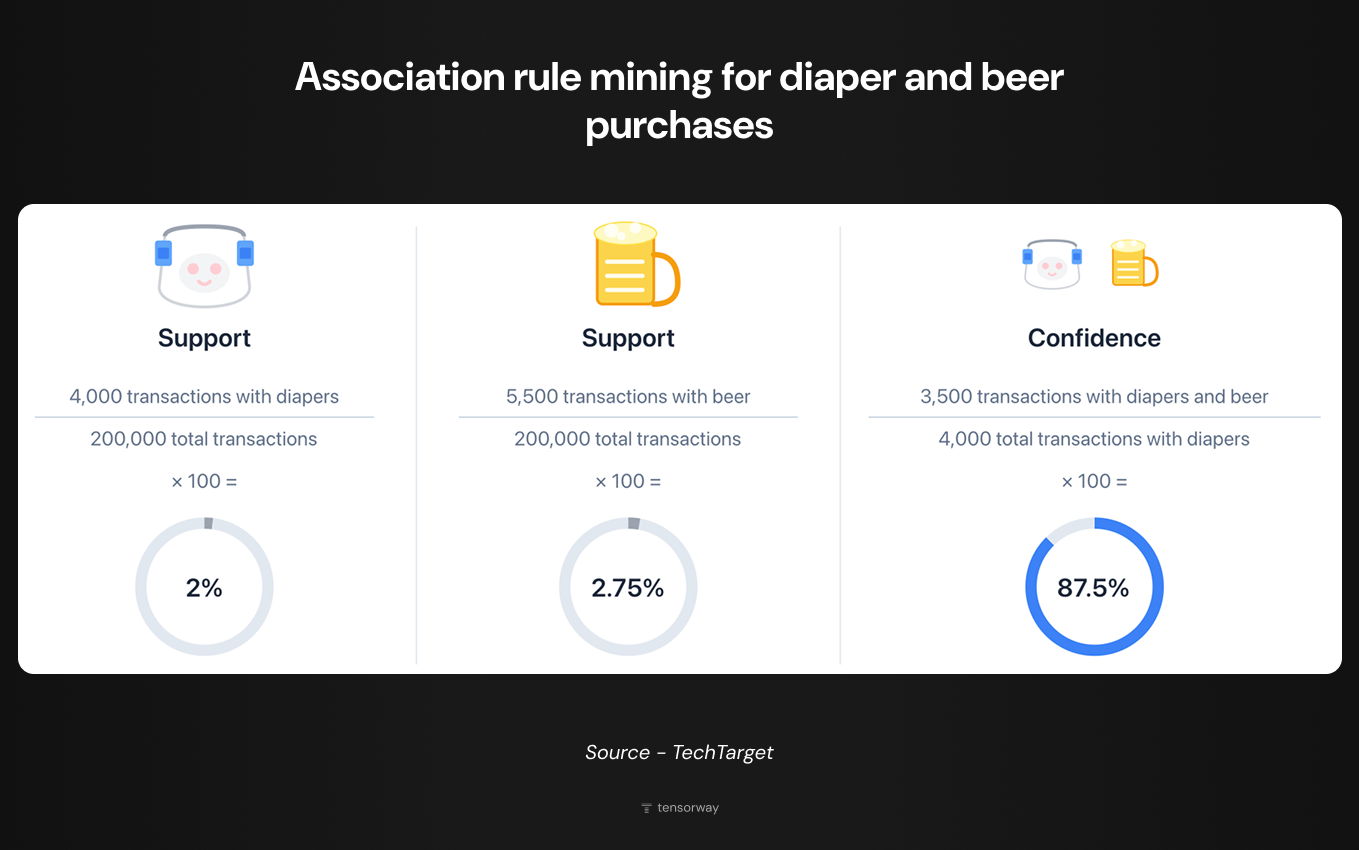
The method became popular thanks to market basket analysis. Retailers studied customer receipts and noticed that certain products are consistently bought together. Not just obvious pairs like bread and butter, but unexpected combinations as well. One American supermarket discovered a correlation between diapers and beer in Friday evening purchases: young parents would stop by for diapers and grab beer for the weekend (check out TechTarget's really worthwhile explanation).
Today association rules underpin recommendation blocks in online stores, music services, and streaming platforms. When Amazon shows "Customers also bought" or Spotify creates weekly playlists, this is the result of analyzing millions of transactions for common patterns.
Apriori Algorithm
Apriori remains the foundational algorithm for this type of task. It processes data in two stages: first it finds combinations of elements that appear more frequently than a given threshold, then forms rules from them.
Rule quality is assessed using three metrics. Support is the fraction of transactions where the combination appears. Confidence is the probability of seeing Y among transactions that already contain X. Lift is how much stronger the connection is compared to random coincidence. If lift equals 1, the elements appear together randomly. Greater than one means there's a real dependency between them.
Unsupervised Machine Learning Examples
Now let's explore specific unsupervised machine learning examples showing how these algorithms work in real business scenarios.
K-Means Clustering
We already mentioned K-Means in the context of hard clustering. A quick reminder of the principle: the algorithm divides data into K groups, where K is set in advance. First, K centers (centroids) are randomly placed, each point is assigned to the nearest center, then the position of centers is recalculated as the average of all points in the group. The process repeats until the centers stabilize.
Online stores use K-Means for customer base segmentation. Input data is purchase history: order frequency, average check, product categories, time between purchases. The algorithm identifies groups with different behavior: buyers with high checks and low frequency, regular mid-segment customers, one-time visitors. Marketing gets a foundation for personalization: different segments need different communications, discounts, and loyalty programs.
Hierarchical Clustering
Hierarchical clustering, as you remember, builds a tree of nested groups. The agglomerative approach starts from the bottom: each object is a separate cluster, then the closest ones merge step by step. Divisive works from the top: one cluster gradually splits into smaller ones.
In pharmaceuticals the method is applied for classifying chemical compounds. A company has a library of thousands of molecules with descriptions of their properties. Hierarchical clustering groups compounds by similarity of structure and biological activity. The result is a taxonomy where researchers see which molecules are related and can search for new drug candidates among neighbors of already known active substances.
DBSCAN
DBSCAN (Density-Based Spatial Clustering of Applications with Noise) is a density-based clustering algorithm. Unlike K-Means, it doesn't require a predetermined number of clusters and doesn't anchor to centroids. Instead, the algorithm looks for areas where points are densely located and combines them into clusters. Points in sparse zones are marked as noise. The main advantage is the ability to find groups of arbitrary shape: elongated, curved, with uneven boundaries.
Logistics companies apply DBSCAN for analyzing geolocation data. Input is delivery coordinates for a month. The algorithm detects hotspots, zones with high order concentration. These can be business centers, residential blocks, shopping areas. The company optimizes routes, places intermediate warehouses closer to activity clusters, reduces delivery time and cost.
Principal Component Analysis (PCA)
PCA is one of the key unsupervised machine learning methods for reducing data dimensionality. When a dataset contains dozens or hundreds of variables, many of them correlate with each other and carry duplicate information. PCA transforms original variables into new, uncorrelated components sorted by the amount of variability they explain. The first component captures the most variation, the second captures the next largest amount, and so on. Usually the first few components contain the bulk of the information, the rest can be discarded without significant loss.
In medical diagnostics PCA processes MRI or CT scans. One image is thousands of pixels, each of which is a separate variable. PCA compresses this information to hundreds of components while preserving key patterns. Then models are trained on the compressed data to detect tumors or anomalies. Without PCA, training would take significantly more time and resources. Similar dimensionality reduction techniques are also applied in audio analysis with machine learning, where raw audio signals contain thousands of features that need compression before model training.
Autoencoders
An autoencoder is a neural network that learns to compress data and restore it back. If input and output match, the network has learned the data structure. Atypical objects are restored with errors, which allows detecting anomalies.
Banks use autoencoders for fraud detection. The model trains on millions of legitimate transactions and learns to reproduce them. When a fraudulent operation with an atypical pattern arrives, the autoencoder cannot reconstruct it correctly. High restoration error signals potential fraud. The system works in real time and adapts to new fraud schemes without manual retraining on labeled examples.Once trained, these models need proper infrastructure to serve predictions at scale (a critical step covered in ML model deployment best practices).
Industry Applications of Unsupervised Learning
Unsupervised machine learning provides a research approach to data analysis that allows companies to quickly identify patterns in large volumes of information. We've gathered application examples from different industries. Perhaps something will spark an idea for your product or suggest a direction for optimizing existing processes.
Healthcare
Clustering patients by symptoms, medical history, and test results helps identify disease subtypes and select personalized treatment. Unsupervised machine learning models power key functions of medical imaging devices: detecting pathologies, classifying and segmenting images in radiology and pathology for rapid diagnosis.
Finance
Fraud detection based on autoencoders identifies atypical transactions in real time. Customer clustering forms the foundation for credit scoring and risk assessment. Banks segment their borrower portfolio to forecast defaults and adapt lending terms for different groups.
E-commerce
Market basket analysis through Apriori builds recommendation blocks and optimizes product placement. Customer persona identification allows better understanding of purchasing habits and creates more accurate buyer profiles. Anomaly detection in sales data signals inventory problems: sharp demand changes, accounting errors, theft.
Manufacturing
Predictive maintenance runs on anomaly detection in equipment sensor data. The algorithm learns normal operation patterns of machinery and signals when readings fall outside the norm. Unsupervised machine learning models detect atypical data points that may indicate faulty equipment or human errors before a breakdown occurs.
Media
Netflix, Spotify, and YouTube cluster content and users for recommendation systems. Google News uses unsupervised machine learning to categorize articles on the same topic from different publications. Audience clustering helps studios make decisions about content production and target promo campaigns.
Cybersecurity
Network intrusion detection analyzes traffic and identifies anomalous patterns: unusual data volumes, atypical activity times, suspicious connections. The unsupervised approach is critical here because new types of attacks don't resemble previous ones and lack labeled examples for training.
Challenges of Unsupervised Learning
The advantages of unsupervised learning are obvious, and the range of applications opens doors to new business opportunities. But like any technological initiative, this method has pitfalls you should be prepared for.
- Computational complexity grows with data volume. Some algorithms require comparing each point with every other point, which with millions of records means serious infrastructure load and longer training time.
- Results are harder to validate. In supervised learning there are accuracy metrics, precision, recall. In unsupervised there's no reference standard for comparison. Expert evaluation is needed: do the identified clusters make sense, are the found associations useful. The risk of inaccurate results is higher, the model may find patterns that are statistical noise rather than real regularities.
- Interpretation isn't always transparent. The algorithm groups data but doesn't explain why it did so. Lack of transparency about the basis of clustering requires additional analysis to understand the distribution logic and verify its business relevance.
Conclusion
Unsupervised learning remains one of the most powerful tools for working with data when labeling is impossible or economically impractical. Clustering, association discovery, dimensionality reduction: each of these methods solves specific business tasks. The key is to properly assess whether the unsupervised approach fits your particular case. If the goal is to explore data structure, find hidden patterns, detect anomalies without prior hypotheses, this is your option. If you need to predict a specific result and have labeled examples, consider supervised methods or their combination.
The technology continues to evolve. New algorithms become faster, handle large data volumes better, and deliver more interpretable results. If you're interested in how you can implement this in your project, contact us.